SpaceBalloon2010 »  Viewing speed_alt     [Image 84 of 86]  :: Jump To  
  First slide Previous slide      Show/Hide EXIF Info Index Page Start/Stop the slide show      Next slide Last slide  
Comment: 
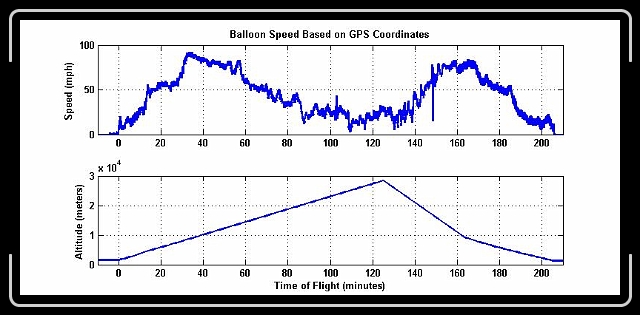
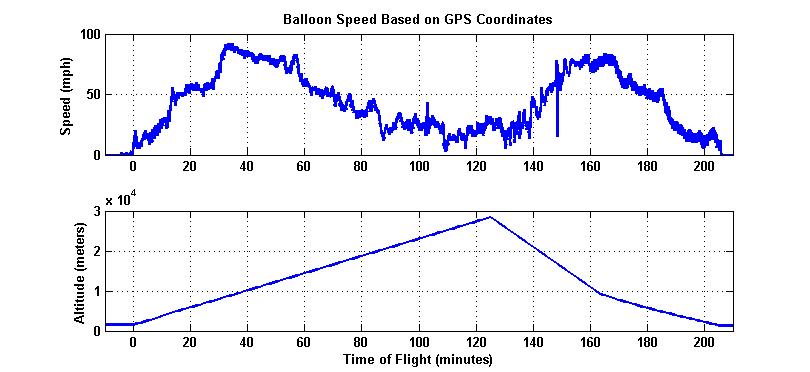
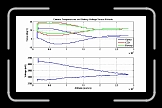
The speed profile showed that the maximum speeds were attained in the middle altitudes when in the jet stream.
SpaceBalloonOlympus 007 * A much deserved meal in Eads after the long chase * A much deserved meal in Eads after the long chase * 2560 x 1920 * (1.07MB)

SpaceBalloonOlympus 021 * An appropriate ending to an adventurous day. * An appropriate ending to an adventurous day. * 2560 x 1920 * (935KB)

altest * Altitude plot extrapoltation, since barometric altimeter solution in GPS saturated at 30k feet. Maximum altitude was determined based on the time of balloon pop as indicated by tumbling in the photos. Linear ascent rate was a reasonable assumption for gross motion of the balloon. Maximum altitude was estimated at 93,687 feet! * Altitude plot extrapoltation, since barometric altimeter solution in GPS saturated at 30k feet. Maximum altitude was determined based on the time of balloon pop as indicated by tumbling in the photos. Linear ascent rate was a reasonable assumption for gross motion of the balloon. Maximum altitude was estimated at 93,687 feet! * 1427 x 684 * (105KB)

pressure * Barometric altitude measurements from Garmin Vista Cx. The slow cadence (~15 mins) of the measurements and the saturation at 300 mBar (30k feet) rendered this data almost useless. * Barometric altitude measurements from Garmin Vista Cx. The slow cadence (~15 mins) of the measurements and the saturation at 300 mBar (30k feet) rendered this data almost useless. * 810 x 372 * (48KB)

speed * Speed as determined by differences in GPS locations from stored track and computed by Garmin MapSource software. Since vertical speed was not measured during the free fall from 93k-30k feet, the maximum speed is likely underrepresented in this plot. * Speed as determined by differences in GPS locations from stored track and computed by Garmin MapSource software. Since vertical speed was not measured during the free fall from 93k-30k feet, the maximum speed is likely underrepresented in this plot. * 810 x 372 * (66KB)

Click for the original image
 
Edge of Space Balloon Photographs
Download file (56KB)
Eads - CO - USA
speed_alt.jpg - 810 x 372 - (56KB) - © Patrick Brown 2010
Patrick Brown
temp_time * Camera temperatures show that all portions remained relatively warm throughout the flight. The battery voltage remained above the low-voltage safe mode of 3.7 Volts throughout the flight. * Camera temperatures show that all portions remained relatively warm throughout the flight. The battery voltage remained above the low-voltage safe mode of 3.7 Volts throughout the flight. * 773 x 358 * (57KB)

temp_alt * The temperature profile shows that the minimum temperatures were not reached until well into re-entry. * The temperature profile shows that the minimum temperatures were not reached until well into re-entry. * 810 x 475 * (61KB)

Album last updated on 1/27/10 7:36 PM
Powered by Jalbum 8.3 and BluPlusPlus skin