SpaceBalloon2010
(86 Slides)
[Page 6 of 6]
::
Jump To
- Page 1
- Page 2
- Page 3
- Page 4
- Page 5
- Page 6
SpaceBalloonKelly 031
SpaceBalloonOlympus 003
SpaceBalloonKelly 038
SpaceBalloonOlympus 007
SpaceBalloonOlympus 021
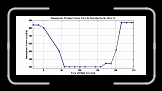
altest
pressure
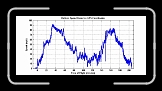
speed
speed_alt
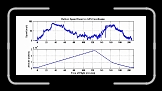
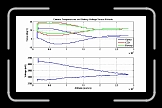
temp_time
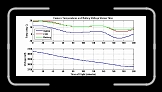
temp_alt
Album last updated on 1/27/10 7:35 PM
Powered by
Jalbum 8.3
and
BluPlusPlus
skin